


In modern web development, data visualization could a significant job for front-end developers, such as charts, maps, graph and data analytics. In this field, there are plents of great players like D3.js, highcharts, Chart.js and Vega. Let me introduce a new player which born in China: AntV, which is a powerful solution you don't want to miss. Here are some reasons I want to recommend it to your guys.

You can visit it's home page for more information: antv.vision
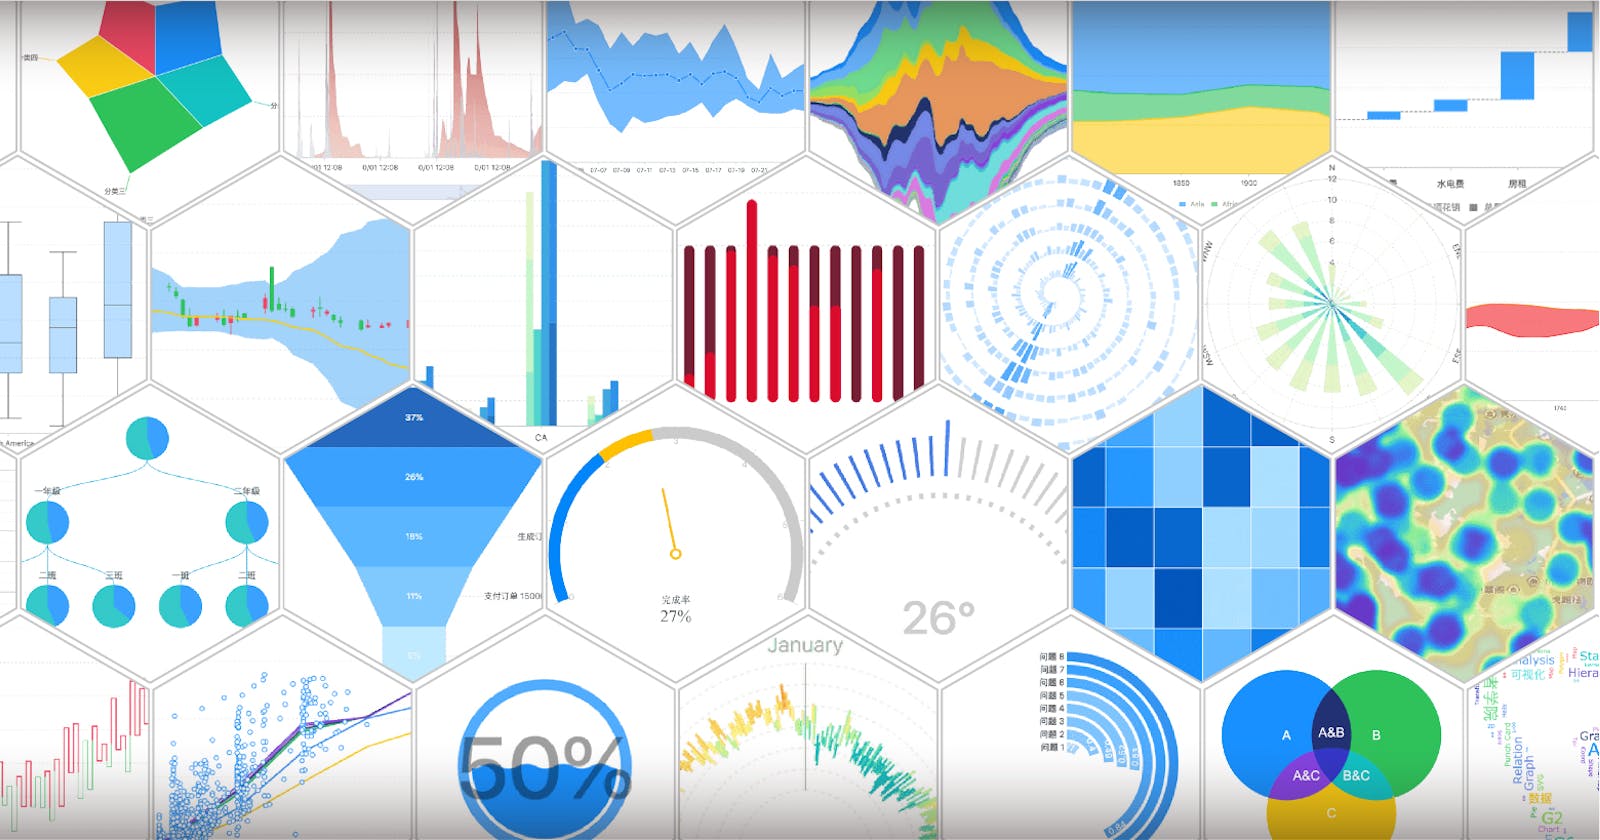
Visualization in all fields
As a data visualization , AntV team provide various of specific solutions for multiple scenarios which includes charts, graph and maps. The deeper you dig in AntV, the more it will surprise you.
- G2: it is a library based on visual encoding for manipulating The Grammar of Graphics. Leland Wilkinson, the author of this book, came and replied in GitHub issue specially. It is data-driven, highly user-friendly and extensible. Users can easily build a variety of interactive statistical graphics without struggling with various complicated details of implementation.


- G2Plot: G2Plot is an interactive and responsive charting library based on g2, provided all kinds of charts with simply API which could satisfy common needs for charts.
- G6: High-perfermance graph library, dozens of built-in layouts and algorithms. You can create a powerful and extrmely customized graph analystic application in a few code.

- F2: specific charting library for mobile devices in many aspects like memory, CPU, bundle size and interaction. Most of charts in Alipay App (800 million users in China) are made of it.
- L7: The altertive map solution of deck.gl based on WebGL, supports Google Maps and Mapbox.

Beside above, AntV contains g (Canvas and SVG render), x6 (diagramming), Graphin (graph analysis react app) which cover all fields of front end data visualization. All libraries are designed and maintianed by the team with unified design specification, similar API and usage. You don't have to seek libraries in communication, AntV has the whole package to finish your visualization work.
Battle-tested
AntV is running in 10,000 applications of Alibaba Group, the biggest e-commerce company in China, from enterprise background applications, mobile web apps, miniapp to large BI systems. For instance, DeepInsight of Ant Financial (biggest BI application in Alibaba, like like Microsoft Power BI) apply AntV solution as it's charts/graph/maps solution very deeply, in which the perfermance, theme and other features of AntV are fully battle-tested. Polished by rich business scenarios for several years, AntV has the ability to support the products with million user visits.
AntV are also one of the most popular data visualization solution in China, thousands of companies are using it. It is a common choice in China that using AntV and Ant Design (the second most popular React UI library in the world, maintained by same team of AntV) together.
Open Source under MIT
Like Ant Design, AntV libraries are all open-source in GitHub organization under MIT licence that makes developers use their for free. AntV team are very acitve in GitHub, willing to reply English question alrough there is lots of Chinese issues out there. They also built beautiful home pages with English and Chinese versions, language will not be an obstacle to use it.

These all are open source:
- G2: github.com/antvis/g2
- G2Plot: github.com/antvis/g2plot
- G6: github.com/antvis/g6
- F2: github.com/antvis/f2
- L7: github.com/antvis/l7
- gatsby-theme-antv: github.com/antvis/gatsby-theme-antv
For Designers
AntV are frendly to not only developers, but designers too. There are the useful design resouces and tools to help designer and other roles finishing their jobs. Chartcube is one of these tools, people can create a chart without writing code, and export as svg/png/code.

AntV design teams provide complete Sketch template. You can also create a chart magiclly in a an awosome Skecth plugin (kitchen)!
What's coming?
AntV team are dedicating to G2@4.0 and G2Plot@1.0 development, it is a complete refactor with tons of improvements in perfermance, interaction and design details, the new version will be published in next month.
Except to build existed charts, AntV team think more. A new project AVA show the potential of automaticly create charts from data, in power of Chart Knowledge Base and rule-based analytics.
import { autoCharts } from '@antv/chart-advisor';

const data = [{
   date: '2020-01',
   value: 100,
}, {
   date: '2020-02',
   value: 200,
}];

autoChart(data, container);
AVA will be open-source in GitHub soon: github.com/antvis/AVA
Conclusion

AntV is a fun, multiple usage scenarios, battle-tested data visualizaton solution which supported by a professional team from China, you might want to try it in your next project.